Performance testing

« Back to documentation home

Delays

There are several options available useful in performance testing.
HTTP fixed delays

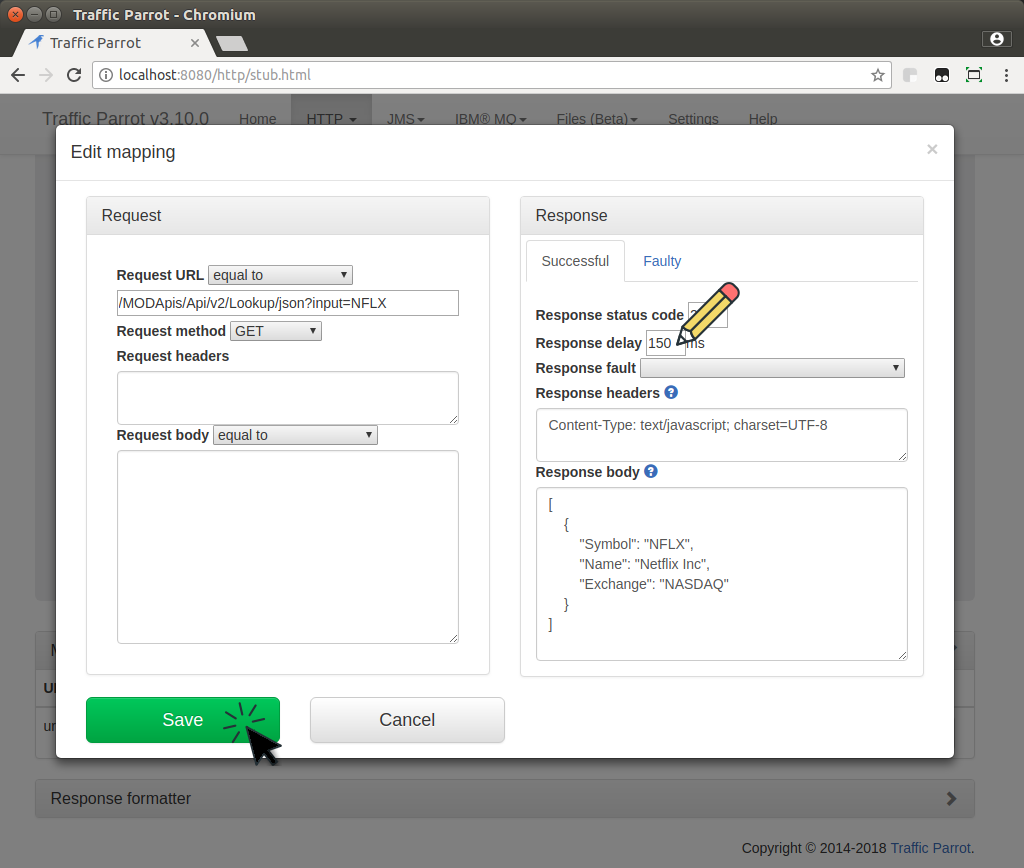
Configurable via the UI. Just change the value of "Response delay" on the HTTP mapping form.
Edit mocked response delay

HTTP random delays

Configure your mapping file to contain:
...
    "response": {
            "status": 200,
            "delayDistribution": {
                    "type": "lognormal",
                    "median": 70,
                    "sigma": 0.3
            }
...

JMS delays

JMS delays are not yet available. Please contact us for more details when they will be available.

Performance profile

Performance profile allows for faster than usual responses in Traffic Parrot.

To enable the performance profile:
  1. use trafficparrot.performance.properties
  2. configure only the extensions and helpers that are in use in the mappings, by default all of them are disabled
  3. disable INFO logs (set log4j to WARN or ERROR only)
  4. configure the operating system
  5. Optional: run a cluster of Traffic Parrot instances behind a load balancer
  6. Optional: if you have any issues contact us
Please note that all mappings in performance mode are loaded into memory from the disk on load so you if you make changes directly on disk to any mappings please do not do it in performance mode.

Low performance?

If you are observing lower than expected performance please contact us.

Please keep in mind that Traffic Parrot performance depends on:
  • speed of hardware or VM, the slower the hardware or VM the slower Traffic Parrot
  • Java version, the older the version the lower the performance
  • number of mappings, the higher number of mapping the lower the performance
  • complexity of dynamic responses, the higher the complexity the lower the performance
  • complexity of the request matching, an "any" matcher will be much faster than a complex one like regexp or jsonpath

Example performance

Test set up

Here is a Traffic Parrot 3.10.0 performance test result to give you a rough idea what you can expect.

The test was performed on a Heztner EX41S-SSD server:
  • Intel® Core™ i7-6700 Quad-Core Skylake incl. Hyper-Threading Technology
  • 64 GB DDR4 RAM
  • SSD
The test was performed on:
  • Ubuntu-1604-xenial-64-minimal 4.10.0-35-generic
  • Java(TM) SE Runtime Environment (build 1.7.0_80-b15)
The test was performed with these settings:
  • Performance profile enabled
  • WARN log level
  • Internal ActiveMQ broker for JMS

Both the test suite and Traffic Parrot were both running on the same server, so both using the same server resources but there was no network latency.

If these numbers are not enough for you, please contact us and we will suggest a setup that will allow for higher performance.

Test results

Protocol tested Number of parallel users Total number of transactions Mappings Total test duration Transaction throughput Average transaction time
HTTP 1000 100,000 requests 22 mappings total:
  • 2 mappings with a urlEqualTo matcher and static response body, both accessed by users
  • 20 mappings that are not accessed by users
Test took 48s to run Throughput for 1,000 concurrent users is 2,099t/s Which results in an average of 0.5ms/t
HTTP 100 100,000 requests 22 mappings total:
  • 2 mappings with a urlEqualTo matcher and static response body, both accessed by users
  • 20 mappings that are not accessed by users
Test took 29s to run Throughput for 100 concurrent users is 3,428t/s Which results in an average of 0.3ms/t
HTTP 1000 100,000 requests 102 mappings total:
  • 1 mapping with a urlEqualTo matcher and dynamic response body, is accessed by users
  • 1 mapping with a urlPathEqualTo, withQueryParam matching, withRequestBody equalToJson matcher, is accessed by users
  • 100 mappings that are not accessed by users
Test took 136s to run Throughput for 1,000 concurrent users is 734t/s Which results in an average of 1.4ms/t
HTTP 100 100,000 requests 102 mappings total:
  • 1 mapping with a urlEqualTo matcher and dynamic response body, is accessed by users
  • 1 mapping with a urlPathEqualTo, withQueryParam matching, withRequestBody equalToJson matcher, is accessed by users
  • 100 mappings that are not accessed by users
Test took 104s to run Throughput for 100 concurrent users is 963t/s Which results in an average of 1ms/t
JMS 1000 300,000 messages (req, rsp, fake) 52 mappings total:
  • 2 mapping with a urlEqualTo body matcher, accessed by users
  • 50 mappings that are not accessed by users
Test took 378s to run Throughput for 1,000 concurrent users is 792trans/s (264task/s) Which results in an average of 1.2ms/trans (3.8ms/task)
JMS 100 30,000 messages (req, rsp, fake) 52 mappings total:
  • 2 mapping with a urlEqualTo body matcher, accessed by users
  • 50 mappings that are not accessed by users
Test took 35s to run Throughput for 100 concurrent users is 858trans/s (286task/s) Which results in an average of 1.2ms/trans (3.5ms/task)

Old version warning!

This documentation is for an old version of Traffic Parrot. There is a more recent Traffic Parrot version available for download at trafficparrot.com

Browse documentation for recent version