There are several options available useful in performance testing.
...
    "response": {
            "status": 200,
            "delayDistribution": {
                    "type": "lognormal",
                    "median": 70,
                    "sigma": 0.3
            }
...
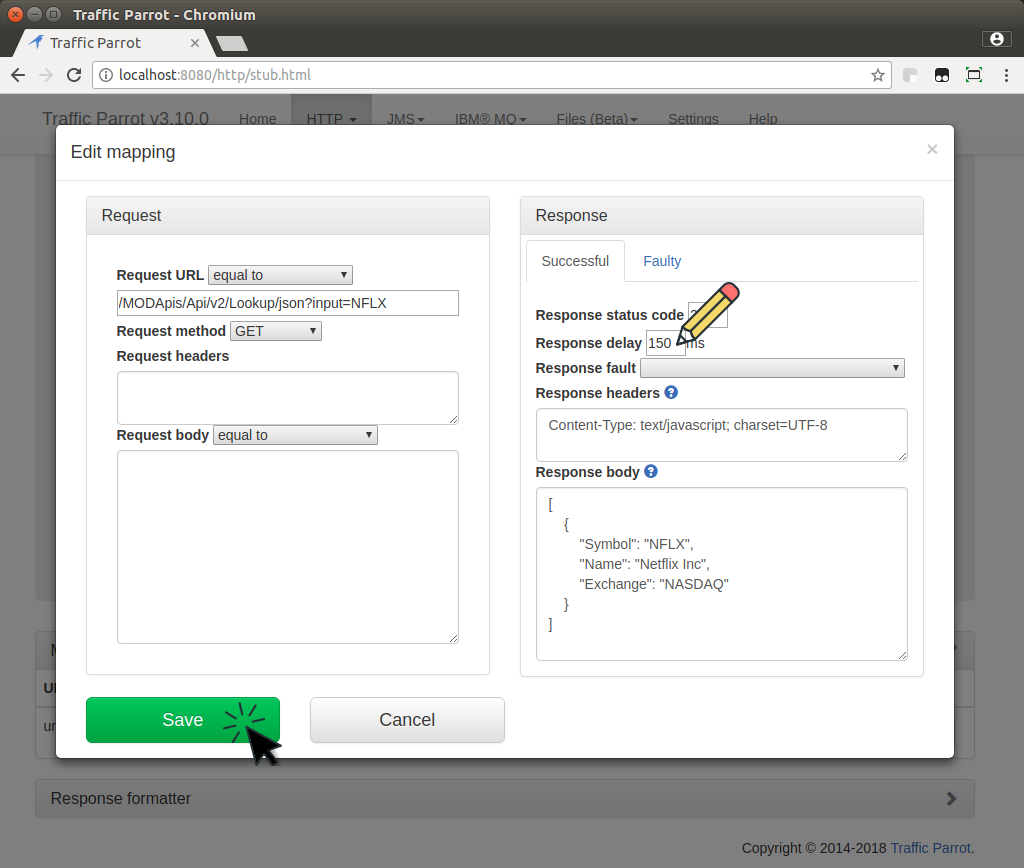
Performance profile allows for faster than usual responses in Traffic Parrot.
To enable the performance profile:For Native IBM MQ you can enable additional logging that displays total processing time of messages.
Here is a list of configuration parameters for tuning Traffic Parrot Native IBM® MQ.
{
    "connectionId": "1",
    "connectionName": "Local Docker MQ 9",
    "connectionData": {
      "ibmMqVersion": "IBM_MQ_9",
      "hostname": "localhost",
      "port": 1414,
      "queueManager": "QM1",
      "channel": "DEV.APP.SVRCONN",
      "username": "app",
      "password": "",
      "useMQCSPAuthenticationMode": false,
      "readConnectionsToOpen": 5,
      "writeConnectionsToOpen": 5,
      "sslCipherSuite": null,
      "sslPeerName": null
    }
},
{
  "mappingId" : "3bc18f0b-9d95-4af1-a2f8-848210b2d8a1",
  "request" : {
    "destination" : {
      "name" : "DEV.QUEUE.1",
      "type" : "QUEUE"
    },
    "bodyMatcher" : {
      "anything" : "anything"
    }
  },
  "response" : {
    "destination" : {
      "name" : "DEV.QUEUE.2",
      "type" : "QUEUE"
    },
    "ibmMqResponseTransformerClassName" : "NO_TRANSFORMER",
    "format" : "MQFMT_STRING",
    "text" : "",
    "fixedDelayMilliseconds" : 0
  },
  "receiveThreads" : 5,
  "sendThreads" : 5
}
If you are observing lower than expected performance please contact us.
Please keep in mind that Traffic Parrot performance depends on:This benchmark demonstrates how hardware resources, network parameters and complexity of virtual services (mocks/stubs) impact Traffic Parrot version 5.12.0 performance for a few sample scenarios. In one example, we show how we improve from 6,000 TPS to 20,000 TPS by increasing the hardware resources and network capacity. In another example, we show that the complexity of the virtual services (mocks/stubs) results in the difference between 1,000 TPS and 6,000 TPS when running on the same hardware and network. Download benchmark PDF here of view the results in web browser below.
| Test setup | Test results | ||||||
|---|---|---|---|---|---|---|---|
| 4 vCPUs HDD 6GB heap 10 Gb/s network | 16 vCPUs SSD 12GB heap 10 Gb/s network | 16 vCPUs SSD 12GB heap 30 Gb/s network | |||||
| Request to response mappings (transactions defined in the virtual service) | Queues and queue managers | TPS | Processing latency (read request message, construct response message, write response message) | TPS | Processing latency (read request message, construct response message, write response message) | TPS | Processing latency (read request message, construct response message, write response message) |
| 20 XML mappings, 100ms fixed delay, Dynamic (2 XPaths), Message size 490B, 1 send threads per queue, 1 receive threads per queue, 5 read connections per QM, 5 write connections per QM, Non-transactional, non-persistent | 20 queues 4 queue managers | 6,022t/s
10,000,000 transactions |
99% under 50.00ms 95% under 20.00ms |
14,984t/s
10,000,000 test transactions |
99% under 40.00ms 95% under 30.00ms |
21,541t/s
10,000,000 test transactions |
99% under 30.00ms, 95% under 20.00ms |
| 20 XML mappings, No delay, Dynamic (2 XPaths), Message size 490B, 1 send threads per queue, 1 receive threads per queue, 5 read connections per QM, 5 write connections per QM, Non-transactional, non-persistent | 20 queues
4 queue managers |
5,751t/s
10,000,000 transactions |
99% under 30.00ms 95% under 20.00ms |
13,425t/s
10,000,000 test transactions |
99% under 50.00ms 95% under 30.00ms |
19,321t/s
10,000,000 test transactions |
99% under 30.00ms |
| 15 XML mappings fixed delays 100ms to 200ms Dynamic (1 to 29 XPaths per message) Message size 500B to 57kB 1-4 send threads depending on the queue 1-4 receive threads depending on the queue 18 read connections per QM 18 write connections per QM Non-transactional, non-persistent |
15 queues 2 queue managers | 1,276t/s
3,080,000 transactions |
99% under 10.00ms 95% under 10.00ms |
4,180t/s
3,080,000 test transactions |
99% under 10.00ms 95% under 10.00ms |
4,472t/s
3,080,000 test transactions |
99% under 10.00ms |
Testing Traffic Parrot version 5.12.0-RC1
IBM MQ 9.1.1.0
Testing Traffic Parrot version 5.12.0-RC1
IBM MQ 9.1.1.0
Same as “16 vCPUs - 12GB heap - 10 Gb/s network” above but:
Here is a Traffic Parrot 3.10.0 performance test result to give you a rough idea what you can expect.
The test was performed on a Heztner EX41S-SSD server:Both the test suite and Traffic Parrot were both running on the same server, so both using the same server resources but there was no network latency.
If these numbers are not enough for you, please contact us and we will suggest a setup that will allow for higher performance.| Protocol tested | Number of parallel users | Total number of transactions | Mappings | Total test duration | Transaction throughput | Average transaction time |
|---|---|---|---|---|---|---|
| HTTP | 1000 | 100,000 requests |
22 mappings total:
|
Test took 48s to run | Throughput for 1,000 concurrent users is 2,099t/s | Which results in an average of 0.5ms/t |
| HTTP | 100 | 100,000 requests |
22 mappings total:
|
Test took 29s to run | Throughput for 100 concurrent users is 3,428t/s | Which results in an average of 0.3ms/t |
| HTTP | 1000 | 100,000 requests |
102 mappings total:
|
Test took 136s to run | Throughput for 1,000 concurrent users is 734t/s | Which results in an average of 1.4ms/t |
| HTTP | 100 | 100,000 requests |
102 mappings total:
|
Test took 104s to run | Throughput for 100 concurrent users is 963t/s | Which results in an average of 1ms/t |
| JMS | 1000 | 300,000 messages (req, rsp, fake) |
52 mappings total:
|
Test took 378s to run | Throughput for 1,000 concurrent users is 792trans/s (264task/s) | Which results in an average of 1.2ms/trans (3.8ms/task) |
| JMS | 100 | 30,000 messages (req, rsp, fake) |
52 mappings total:
|
Test took 35s to run | Throughput for 100 concurrent users is 858trans/s (286task/s) | Which results in an average of 1.2ms/trans (3.5ms/task) |
This documentation is for an old version of Traffic Parrot. There is a more recent Traffic Parrot version available for download at trafficparrot.com