There are several options available useful in performance testing.
...
    "response": {
            "status": 200,
            "delayDistribution": {
                    "type": "lognormal",
                    "median": 70,
                    "sigma": 0.3
            }
...
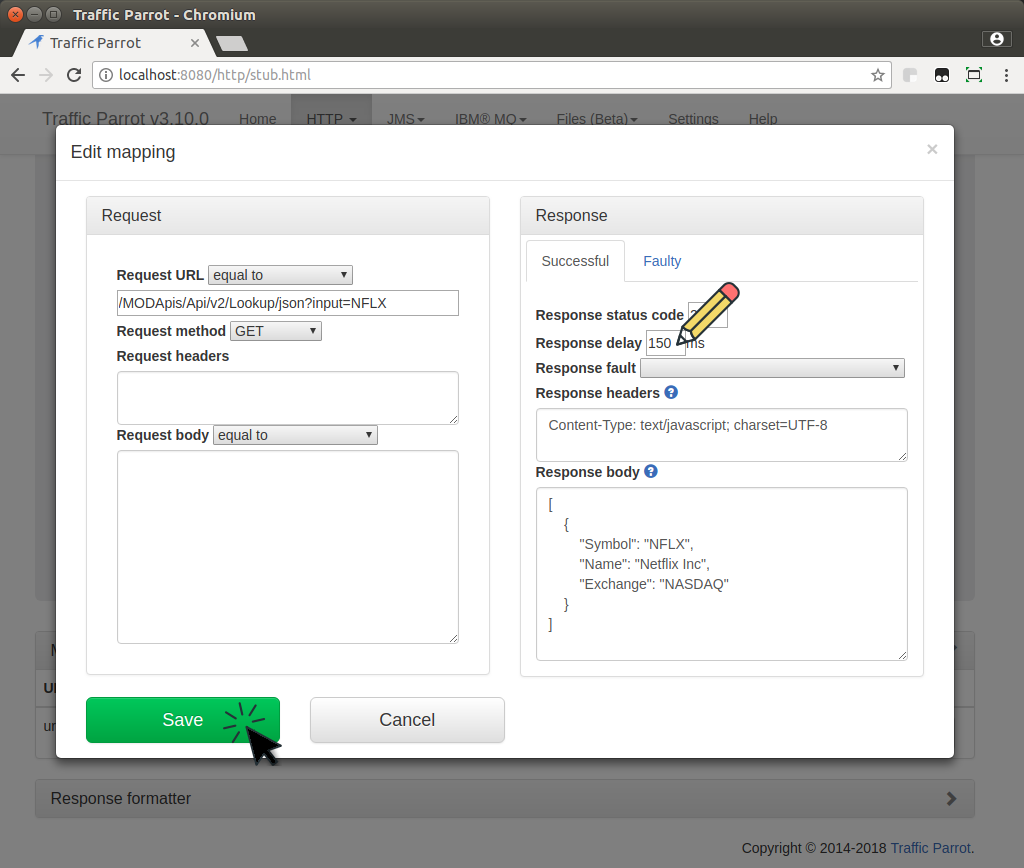
Performance profile allows for faster than usual responses in Traffic Parrot.
To enable the performance profile:For Native IBM MQ you can enable additional logging that displays total processing time of messages.
Here is a list of configuration parameters for tuning Traffic Parrot Native IBM® MQ.
{
    "connectionId": "1",
    "connectionName": "Local Docker MQ 9",
    "connectionData": {
      "ibmMqVersion": "IBM_MQ_9",
      "hostname": "localhost",
      "port": 1414,
      "queueManager": "QM1",
      "channel": "DEV.APP.SVRCONN",
      "username": "app",
      "password": "",
      "useMQCSPAuthenticationMode": false,
      "readConnectionsToOpen": 5,
      "writeConnectionsToOpen": 5,
      "sslCipherSuite": null,
      "sslPeerName": null
    }
},
{
  "mappingId" : "3bc18f0b-9d95-4af1-a2f8-848210b2d8a1",
  "request" : {
    "destination" : {
      "name" : "DEV.QUEUE.1",
      "type" : "QUEUE"
    },
    "bodyMatcher" : {
      "anything" : "anything"
    }
  },
  "response" : {
    "destination" : {
      "name" : "DEV.QUEUE.2",
      "type" : "QUEUE"
    },
    "ibmMqResponseTransformerClassName" : "NO_TRANSFORMER",
    "format" : "MQFMT_STRING",
    "text" : "",
    "fixedDelayMilliseconds" : 0
  },
  "receiveThreads" : 5,
  "sendThreads" : 5
}
If you are observing lower than expected performance please contact us.
Please keep in mind that Traffic Parrot performance depends on:This benchmark demonstrates how hardware resources, network parameters and complexity of virtual services (mocks/stubs) impact Traffic Parrot version 5.12.0 performance for a few sample scenarios. In one example, we show how we improve from 6,000 TPS to 20,000 TPS by increasing the hardware resources and network capacity. In another example, we show that the complexity of the virtual services (mocks/stubs) results in the difference between 1,000 TPS and 6,000 TPS when running on the same hardware and network. Download benchmark PDF here of view the results in web browser below.
| Test setup | Test results | ||||||
|---|---|---|---|---|---|---|---|
| 4 vCPUs HDD 6GB heap 10 Gb/s network | 16 vCPUs SSD 12GB heap 10 Gb/s network | 16 vCPUs SSD 12GB heap 30 Gb/s network | |||||
| Request to response mappings (transactions defined in the virtual service) | Queues and queue managers | TPS | Processing latency (read request message, construct response message, write response message) | TPS | Processing latency (read request message, construct response message, write response message) | TPS | Processing latency (read request message, construct response message, write response message) |
| 20 XML mappings, 100ms fixed delay, Dynamic (2 XPaths), Message size 490B, 1 send threads per queue, 1 receive threads per queue, 5 read connections per QM, 5 write connections per QM, Non-transactional, non-persistent | 20 queues 4 queue managers | 6,022t/s
10,000,000 transactions |
99% under 50.00ms 95% under 20.00ms |
14,984t/s
10,000,000 test transactions |
99% under 40.00ms 95% under 30.00ms |
21,541t/s
10,000,000 test transactions |
99% under 30.00ms, 95% under 20.00ms |
| 20 XML mappings, No delay, Dynamic (2 XPaths), Message size 490B, 1 send threads per queue, 1 receive threads per queue, 5 read connections per QM, 5 write connections per QM, Non-transactional, non-persistent | 20 queues
4 queue managers |
5,751t/s
10,000,000 transactions |
99% under 30.00ms 95% under 20.00ms |
13,425t/s
10,000,000 test transactions |
99% under 50.00ms 95% under 30.00ms |
19,321t/s
10,000,000 test transactions |
99% under 30.00ms |
| 15 XML mappings fixed delays 100ms to 200ms Dynamic (1 to 29 XPaths per message) Message size 500B to 57kB 1-4 send threads depending on the queue 1-4 receive threads depending on the queue 18 read connections per QM 18 write connections per QM Non-transactional, non-persistent |
15 queues 2 queue managers | 1,276t/s
3,080,000 transactions |
99% under 10.00ms 95% under 10.00ms |
4,180t/s
3,080,000 test transactions |
99% under 10.00ms 95% under 10.00ms |
4,472t/s
3,080,000 test transactions |
99% under 10.00ms |
Testing Traffic Parrot version 5.12.0-RC1
IBM MQ 9.1.1.0
Testing Traffic Parrot version 5.12.0-RC1
IBM MQ 9.1.1.0
Same as “16 vCPUs - 12GB heap - 10 Gb/s network” above but:
Tested on Google Cloud Platform C4 VMs (INTEL(R) XEON(R) PLATINUM 8581C CPU @ 2.30GHz) running with STANDARD network, hyperdisk-balanced 10GB.
| 2 CPUs | 4 CPUs | 8 CPUs | 16 CPUs | |
|---|---|---|---|---|
| Test request headers ask for gzipped content (Accept-Encoding: gzip) | Yes | |||
| Log level | ERROR | |||
| trafficparrot.virtualservice.jettyAcceptors | 5 | 5 | 8 | 16 |
| trafficparrot.virtualservice.containerThreads | 500 | 500 | 1000 | 1000 |
| Other properties |
trafficparrot.virtualservice.containerThreads=500 trafficparrot.virtualservice.maxRequestJournalEntries=0 trafficparrot.virtualservice.mapping.cache.milliseconds=48000000 trafficparrot.virtualservice.mapping.cache.populate.on.startup=true trafficparrot.virtualservice.handlebars.select.indexAndCacheCsvFiles=true trafficparrot.virtualservice.accessLogsEnabled=false trafficparrot.virtualservice.handlebars.maxCacheEntries=0 trafficparrot.virtualservice.httpRequestLoggingDisabled=true |
|||
-Xmx:(as per the table spec)
-Xms:1g
-XX:+UseG1GC
-XX:+PrintCommandLineFlags
-XX:+HeapDumpOnOutOfMemoryError
-Djdk.security.allowNonCaAnchor
-Dtrafficparrot.properties.filename=trafficparrot.properties
-Dtrafficparrotserver.logging.properties.filename=trafficparrotserver.log4j2.xml
-Djdk.serialFilter=*
-Djava.rmi.server.useCodebaseOnly=false
-Dcom.sun.management.jmxremote
-Djava.rmi.server.hostname=x.y.z.z
-Dcom.sun.management.jmxremote.port=8084
-Dcom.sun.management.jmxremote.rmi.port=8099
-Dcom.sun.management.jmxremote.authenticate=false
-Dcom.sun.management.jmxremote.ssl=false
-XX:+UseLargePages
These benchmarks demonstrate that if you double the number of CPUs you can roughly double the performance you get out of Traffic Parrot, for the type mappings tested in this benchmark.
They also demonstrate you can use "tricks" to 5-15x your mocks performance. The example in the benchmark below shows that if you have a static response, and it's quite large, 500kB, you can gzip the response content inside the mapping. That way gzipping of the response body is not done every time a response is sent, and you can 5 or even 15x performance on low CPU machines.
If you would like to learn more performance "tricks" applicable to your performanmce testing use case, pelase contact us.
| 2 CPUs 2GB Heap |
4 CPUs 4GB Heap |
8 CPUs 4 GB Heap |
16 CPUs 8 GB Heap |
|
|---|---|---|---|---|
| 1 mapping with a static response 300B 200 parallel requests/threads |
11815.2 req/s Min Response Time: 0ms Max Response Time: 1658ms Avg Response Time: 16.20ms 95th Percentile Response Time: 45ms 99th Percentile Response Time: 108ms Success Count: 1000000 Failure Count: 0 |
35621.4 req/s Min Response Time: 0ms Max Response Time: 1431ms Avg Response Time: 4.79ms 95th Percentile Response Time: 14ms 99th Percentile Response Time: 32ms Success Count: 1000000 Failure Count: 0 |
60193.8 req/s Min Response Time: 0ms Max Response Time: 1126ms Avg Response Time: 2.09ms 95th Percentile Response Time: 6ms 99th Percentile Response Time: 15ms Success Count: 1000000 Failure Count: 0 |
70452.3 req/s Min Response Time: 0ms Max Response Time: 1124ms Avg Response Time: 1.57ms 95th Percentile Response Time: 4ms 99th Percentile Response Time: 7ms Success Count: 1000000 Failure Count: 0 |
| 1 mapping with a static response 500kB 200 parallel requests/threads |
171.0 req/s Min Response Time: 0ms Max Response Time: 6634ms Avg Response Time: 719.19ms 95th Percentile Response Time: 2747ms 99th Percentile Response Time: 4138ms Success Count: 99995 Failure Count: 5 |
352.8 req/s Min Response Time: 1ms Max Response Time: 4949ms Avg Response Time: 385.43ms 95th Percentile Response Time: 1667ms 99th Percentile Response Time: 2678ms Success Count: 99999 Failure Count: 1 |
663.2 req/s Min Response Time: 1ms Max Response Time: 2407ms Avg Response Time: 193.52ms 95th Percentile Response Time: 771ms 99th Percentile Response Time: 1347ms Success Count: 100000 Failure Count: 0 |
1333.8 req/s Min Response Time: 1ms Max Response Time: 2214ms Avg Response Time: 77.97ms 95th Percentile Response Time: 322ms 99th Percentile Response Time: 724ms Success Count: 100000 Failure Count: 0 |
| 1 mapping with a static response 500kB already pre-gzipped in the mapping file 200 parallel requests/threads |
3630.0 req/s Min Response Time: 0ms Max Response Time: 1772ms Avg Response Time: 51.56ms 95th Percentile Response Time: 198ms 99th Percentile Response Time: 594ms Success Count: 100000 Failure Count: 0 |
7647.0 req/s Min Response Time: 0ms Max Response Time: 1283ms Avg Response Time: 24.40ms 95th Percentile Response Time: 73ms 99th Percentile Response Time: 183ms Success Count: 100000 Failure Count: 0 |
13024.2 req/s Min Response Time: 0ms Max Response Time: 1202ms Avg Response Time: 10.54ms 95th Percentile Response Time: 31ms 99th Percentile Response Time: 52ms Success Count: 100000 Failure Count: 0 |
17067.8 req/s Min Response Time: 0ms Max Response Time: 1147ms Avg Response Time: 3.36ms 95th Percentile Response Time: 11ms 99th Percentile Response Time: 27ms Success Count: 100000 Failure Count: 0 |
This documentation is for an old version of Traffic Parrot. There is a more recent Traffic Parrot version available for download at trafficparrot.com