
Traffic Parrot can show a platform team how it is used across the company: which teams and projects run it, how many licenses each holds, and what each instance has loaded and serves. The figures are served as Prometheus metrics for your own Prometheus server to scrape, and Grafana dashboards show them. The metrics endpoints send nothing to Traffic Parrot: they are read by your own Prometheus.
Two endpoints serve the metrics, and they cover different instances:
Both are off by default and switched on by one property each. Team tags label the series of both with the team and project an instance belongs to.
Every metric is a count or a gauge. Label values come only from fixed sets (protocol, outcome, version, edition) and from the team tags you set. No metric name or label value is ever taken from traffic: no headers, bodies, URLs, mapping names, scenario names, user names or host names.
For the Java virtual machine's own figures (memory, threads, garbage collection) see Monitoring via JMX in the user guide.
To let your Prometheus scrape a Traffic Parrot instance, set in trafficparrot.properties:
trafficparrot.telemetry.enabled=true
The instance then serves GET /api/metrics on its user interface ports: the HTTP port (trafficparrot.gui.http.port, 8080 by default) and the HTTPS port (trafficparrot.gui.https.port, 8079 by default), the ports that serve the user interface and /api/health, not the HTTP management port. The response is in Prometheus text format, content type text/plain with the parameters version=0.0.4 and charset=utf-8, whatever the request's Accept header asks for. With the property false, its default, the path is not served.
The endpoint is protected like the rest of the user interface. With trafficparrot.gui.security.mode=LOGIN_PROPERTIES it asks for HTTP Basic credentials, and any user in trafficparrot.gui.login.properties can scrape, a view-only one included (see Role based access). With Okta single sign-on the path is exempt from the login, like the health paths, so a scrape needs no token and anyone who can reach the user interface port can read the metrics while they are on. With an invalid license the user interface starts with /api/health only, so there are no metrics.
The response carries these metrics:
| Metric | Type | Labels | Value |
|---|---|---|---|
| tp_instance | gauge | version, edition | This Traffic Parrot instance, valued 1, by version and edition. |
| tp_mappings | gauge | protocol: http, grpc, ibmmq, jms, file, websocket | HTTP, gRPC, IBM® MQ, JMS, file and WebSocket mappings loaded in the current scenario now, by protocol. It counts what is loaded: an HTTP mapping added through the API and not saved counts, the recording proxy and the default proxy do not, and the WebSocket mappings count whether or not WebSocket is enabled. A count that cannot be read, for example http while the virtual service starts, reads NaN. |
| tp_requests_total | counter | protocol: http, grpc, websocket, jms, ibmmq, file; outcome: matched, unmatched, proxied (proxied for http, grpc and websocket) | Requests served by the virtual service, by protocol and outcome: matched (answered by a mapping, or by Traffic Parrot itself, such as an automatic OPTIONS reply or an OpenAPI validation error), unmatched (nothing matched), proxied (forwarded to another system: recording, proxy mappings, the HTTP Proxy page and the default proxy). For IBM MQ, JMS and file, each message that replay receives counts once, as matched or unmatched. For gRPC, each request message counts once, so a streaming call counts each message a client sends; a mapping that answers with an error status or with no response counts as matched, and in record mode each message forwarded to the real service counts as proxied when it is sent, so a forward to a service that is down still counts. For WebSocket, each text message a client sends counts once: proxied while recording (forwarded to the real backend), otherwise matched or unmatched. For HTTP, not counted: calls to the management API, requests the rate limiter refuses, and browser CORS preflight requests. For messaging: a message received through the JMS replay page counts as jms whichever broker it came from, IBM MQ's JMS client included; files in local, SFTP and FTP directories all count as file; a file that stays in its directory counts again each time replay starts, whether it matched nothing or matched and was left in place because its reply failed or it could not be removed; a message that cannot be read, or whose matching ends in an error, is not counted; and the messages that messaging record mode forwards are not counted yet. For gRPC, not counted: a call to a method no proto file defines, server reflection calls, a message that cannot be read against its proto or whose matching ends in an error, and in record mode a bidirectional streaming call, a method no recording target covers, or a client-streaming call cancelled before it completes. For WebSocket, not counted: binary messages, on-connect actions, and a message on a connection that recording closed because its backend could not be reached. |
| tp_recording_sessions_total | counter | protocol: http | Recording sessions started successfully, by protocol, from the Recording page or the Proxy page's Record option. Starting a recording while one is already on counts another session. Counted for HTTP. |
| tp_mapping_changes_total | counter | protocol: http; action: create, update, delete; source: gui, api, mcp, import, recording | Mappings created, updated and deleted while Traffic Parrot runs, by protocol, action and source (a page, any other API call, the MCP tools, an import, a recording). HTTP only so far. Each source and what is not counted: below. |
| tp_imports_total | counter | format: openapi, har, raml, pact, mountebank, curl, wiremock | Imports that added at least one mapping, by format: one per file imported on the HTTP Import page or through its API (a selection imported from the preview included), and one per MCP generate_mappings_from_openapi call. A zip's mappings count once as wiremock, and each specification file in the zip as its own format. An import that adds nothing, and the OpenAPI files Traffic Parrot imports at start-up, are not counted. Not counted yet: AsyncAPI and Pact message imports, imports on the gRPC, JMS, IBM MQ and file message pages, and WireMock's /__admin/mappings/import. |
A mistyped page address on a user interface port counts as http unmatched: the user interface forwards a path it does not serve to the virtual service (trafficparrot.gui.forwardToVirtualService.enabled, on by default).
Every series also carries the team tags, with project defaulting to the project name. The request counter has series for HTTP, gRPC, WebSocket, JMS, IBM MQ and file (no proxied series for the messaging protocols), the recording counter for HTTP, the mapping-changes counter for the HTTP series something counts (gui, api and mcp with each action, import and recording with create) and the import counter for each of its formats, and they start at 0 when the instance starts, so a Prometheus increase() or rate() over them sees the first event.
Part of a scrape of an instance tagged team=payments and application=checkout-api, with project defaulted to its project name, after one request that matched no mapping:
# HELP tp_mappings HTTP, gRPC, IBM MQ, JMS, file and WebSocket mappings loaded in the current scenario now, by protocol.
# TYPE tp_mappings gauge
tp_mappings{application="checkout-api",project="checkout",protocol="http",team="payments"} 0.0
tp_mappings{application="checkout-api",project="checkout",protocol="jms",team="payments"} 0.0
# HELP tp_requests_total Requests served by the virtual service, by protocol and outcome: matched (answered by a mapping, or by Traffic Parrot itself, such as an automatic OPTIONS reply or an OpenAPI validation error), unmatched (nothing matched), proxied (forwarded to another system: recording, proxy mappings, the HTTP Proxy page and the default proxy). For IBM MQ, JMS and file, each message that replay receives counts once, as matched or unmatched. For gRPC, each request message counts once, so a streaming call counts each message a client sends; for WebSocket, each text message a client sends: matched, unmatched, or proxied (forwarded to the real backend).
# TYPE tp_requests_total counter
tp_requests_total{application="checkout-api",outcome="matched",project="checkout",protocol="grpc",team="payments"} 0.0
tp_requests_total{application="checkout-api",outcome="proxied",project="checkout",protocol="grpc",team="payments"} 0.0
tp_requests_total{application="checkout-api",outcome="unmatched",project="checkout",protocol="grpc",team="payments"} 0.0
tp_requests_total{application="checkout-api",outcome="matched",project="checkout",protocol="http",team="payments"} 0.0
tp_requests_total{application="checkout-api",outcome="proxied",project="checkout",protocol="http",team="payments"} 0.0
tp_requests_total{application="checkout-api",outcome="unmatched",project="checkout",protocol="http",team="payments"} 1.0
tp_requests_total{application="checkout-api",outcome="matched",project="checkout",protocol="jms",team="payments"} 0.0
tp_requests_total{application="checkout-api",outcome="unmatched",project="checkout",protocol="jms",team="payments"} 0.0
tp_requests_total{application="checkout-api",outcome="matched",project="checkout",protocol="websocket",team="payments"} 0.0
tp_requests_total{application="checkout-api",outcome="proxied",project="checkout",protocol="websocket",team="payments"} 0.0
tp_requests_total{application="checkout-api",outcome="unmatched",project="checkout",protocol="websocket",team="payments"} 0.0
# HELP tp_mapping_changes_total Mappings created, updated and deleted while Traffic Parrot runs, by protocol, action and source: gui (a Traffic Parrot page), api (any other API call), mcp (the MCP tools), import (the Import page and its API, one per mapping imported), recording (one per mapping recorded). Mappings loaded from files, and changes made by rule rather than by id (a reset, a remove by pattern, a cleanup), are not counted.
# TYPE tp_mapping_changes_total counter
tp_mapping_changes_total{action="create",application="checkout-api",project="checkout",protocol="http",source="api",team="payments"} 0.0
tp_mapping_changes_total{action="create",application="checkout-api",project="checkout",protocol="http",source="gui",team="payments"} 0.0
tp_mapping_changes_total{action="create",application="checkout-api",project="checkout",protocol="http",source="import",team="payments"} 0.0
tp_mapping_changes_total{action="create",application="checkout-api",project="checkout",protocol="http",source="mcp",team="payments"} 0.0
tp_mapping_changes_total{action="create",application="checkout-api",project="checkout",protocol="http",source="recording",team="payments"} 0.0
tp_mapping_changes_total{action="delete",application="checkout-api",project="checkout",protocol="http",source="api",team="payments"} 0.0
tp_mapping_changes_total{action="delete",application="checkout-api",project="checkout",protocol="http",source="gui",team="payments"} 0.0
tp_mapping_changes_total{action="delete",application="checkout-api",project="checkout",protocol="http",source="mcp",team="payments"} 0.0
tp_mapping_changes_total{action="update",application="checkout-api",project="checkout",protocol="http",source="api",team="payments"} 0.0
tp_mapping_changes_total{action="update",application="checkout-api",project="checkout",protocol="http",source="gui",team="payments"} 0.0
tp_mapping_changes_total{action="update",application="checkout-api",project="checkout",protocol="http",source="mcp",team="payments"} 0.0
# HELP tp_imports_total Imports that added at least one mapping, by format: one per file imported on the HTTP Import page or through its API (a selection imported from the preview included), and one per MCP generate_mappings_from_openapi call. A zip's mappings count once as wiremock, and each specification file in the zip as its own format. An import that adds nothing, and the OpenAPI files Traffic Parrot imports at start-up, are not counted.
# TYPE tp_imports_total counter
tp_imports_total{application="checkout-api",format="curl",project="checkout",team="payments"} 0.0
tp_imports_total{application="checkout-api",format="har",project="checkout",team="payments"} 0.0
tp_imports_total{application="checkout-api",format="mountebank",project="checkout",team="payments"} 0.0
tp_imports_total{application="checkout-api",format="openapi",project="checkout",team="payments"} 0.0
tp_imports_total{application="checkout-api",format="pact",project="checkout",team="payments"} 0.0
tp_imports_total{application="checkout-api",format="raml",project="checkout",team="payments"} 0.0
tp_imports_total{application="checkout-api",format="wiremock",project="checkout",team="payments"} 0.0
An example Prometheus scrape configuration:
scrape_configs:
  - job_name: traffic-parrot
    metrics_path: /api/metrics
    static_configs:
      - targets: ['traffic-parrot-host:8080']
    basic_auth:            # only with trafficparrot.gui.security.mode=LOGIN_PROPERTIES
      username: readonly
      password: <password>
In the user interface, Tools, Monitoring shows, for the running instance:
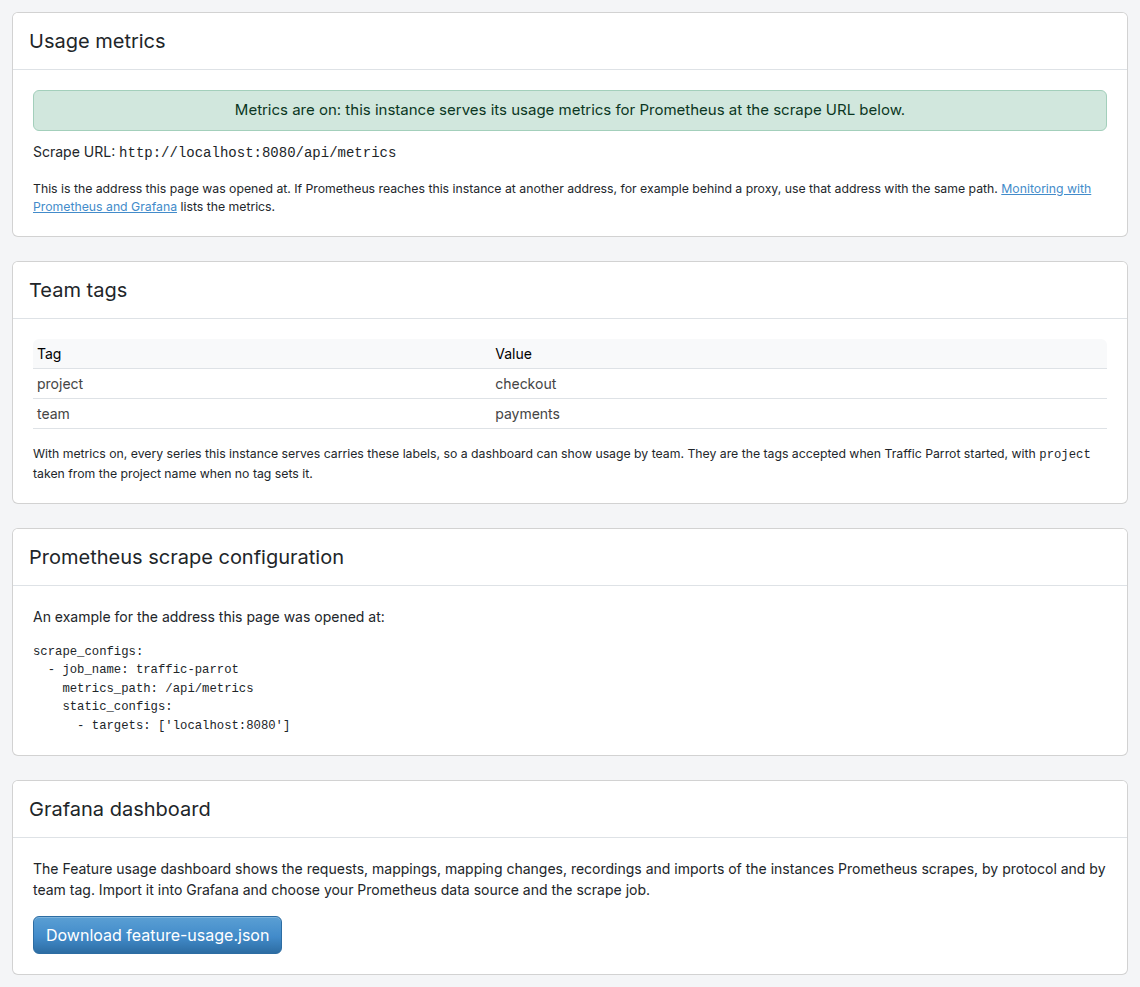
The page is there whether metrics are on or off, and a view-only user can open it and download the dashboard. Before you copy the example:
tp_mapping_changes_total counts each change where it is made, one per mapping, for HTTP mappings; the other protocols' mapping changes are not counted yet. The source is the entry point:
| Source | What counts |
|---|---|
| gui | A Traffic Parrot page or the HTTP mapping editor: a management API call carrying X-Requested-With: XMLHttpRequest, which every page sends. Create, update or delete, one per mapping; a bulk delete counts each mapping. |
| api | Any other management API call (a script, CI, the WireMock client): create, update or delete, one per mapping. An OAuth2 mock scaffold counts its three mappings here, or under gui when made from the HTTP Add/Edit page. |
| mcp | The MCP tools create_mapping, update_mapping and delete_mapping when applied (a dry run counts nothing), and generate_mappings_from_openapi, one create per mapping it saved. |
| import | The Import page and its API, one create per mapping an import added. An import that fails part-way, after adding some mappings, counts none of them. |
| recording | One create per mapping a recording saves. A request the recorder skips because it was already recorded counts nothing. |
Not counted: mappings Traffic Parrot loads or adds itself (start-up, a scenario switch, a reload from disk, the start-up OpenAPI import, the default proxy mapping); the mappings list's Not saved button; what an import replaces; a change the API refused; management calls that change mappings by rule rather than by id (/__admin/reset, DELETE /__admin/mappings, /__admin/mappings/reset, /__admin/mappings/remove, /__admin/mappings/remove-by-metadata, DELETE /__admin/mappings/unmatched, /__admin/mappings/save, /__admin/mappings/import and WireMock's own recorder); and the Cleanup page and MCP cleanup_mappings, which rewrite the files on disk.
An on-premise license server that serves metrics (one from before this feature answers /metrics with 404) serves GET /metrics on its user interface ports (8050 for HTTP and 8051 for HTTPS by default) once metrics.enabled=true is set in its licenseusage.properties, with no credentials, like the rest of that interface. With the property off, /metrics answers 404; until the first usage snapshot has been built after start-up, it answers 503. The response is in Prometheus text format and carries these metrics:
| Metric | Type | Labels | Value |
|---|---|---|---|
| tp_licences_purchased | gauge | Licenses the license file allows. | |
| tp_licences_in_use | gauge | team tags, version | Licenses checked out now, by team tag and Traffic Parrot version. |
| tp_licence_rejections_total | counter | team tags | License check-outs refused because none was free, since the license server started. |
| tp_mappings | gauge | team tags, protocol: http, grpc, ibmmq, jms | Mappings loaded on checked-out instances at instance start-up, summed, by protocol and team tag. |
The project label is the instance's project tag, or the project name it reports when it sends no such tag, so licenses group by project before any instance is upgraded to a release that sends tags. An instance that lacks a tag reads none for it. No host name, IP address or user name appears in any label. The license server's tp_mappings is the count each instance reported at its start-up, while the instance's own tp_mappings is what it has loaded now. An instance that stops without checking its license in stays counted in tp_licences_in_use until its license times out (license.time.out.in.minutes, five minutes by default), plus up to about two minutes until the next check and refresh of the figures. Up to nine other tag names are used as labels, in the order the license server first sees them after it starts; a tag name beyond that is dropped and named in a warning. Refused check-outs beyond 1000 distinct label sets are counted under other.
An example Prometheus scrape configuration, with the license server as its own job (two license servers in one job would add up their licenses in use while showing one server's purchased):
scrape_configs:
  - job_name: traffic-parrot-license-server
    static_configs:
      - targets: ['licensehost:8050']
The License usage dashboard shows the license server's metrics. It is a Grafana dashboard JSON file that imports into Grafana 10 or later with no edits: it takes its data source from a datasource variable, so it works with any Prometheus data source. At the top you pick the data source, the license server (its Prometheus job) and whether to break the figures down by project, by team or by both. Its panels answer:
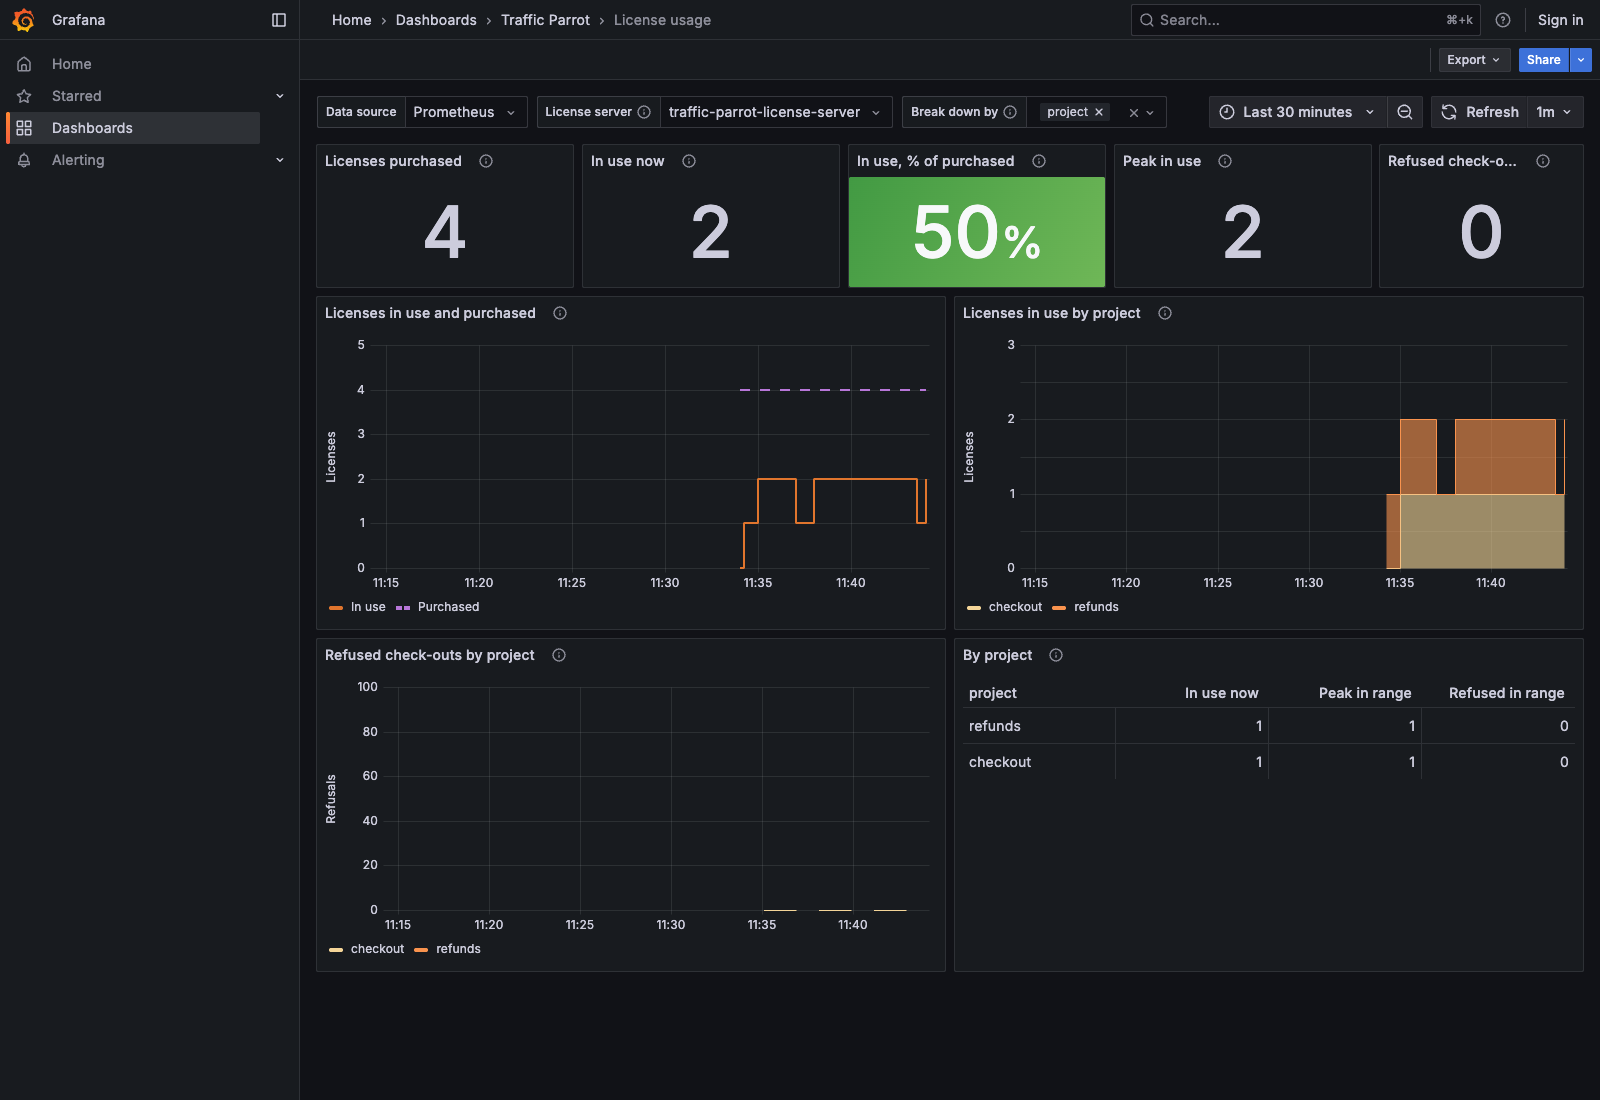
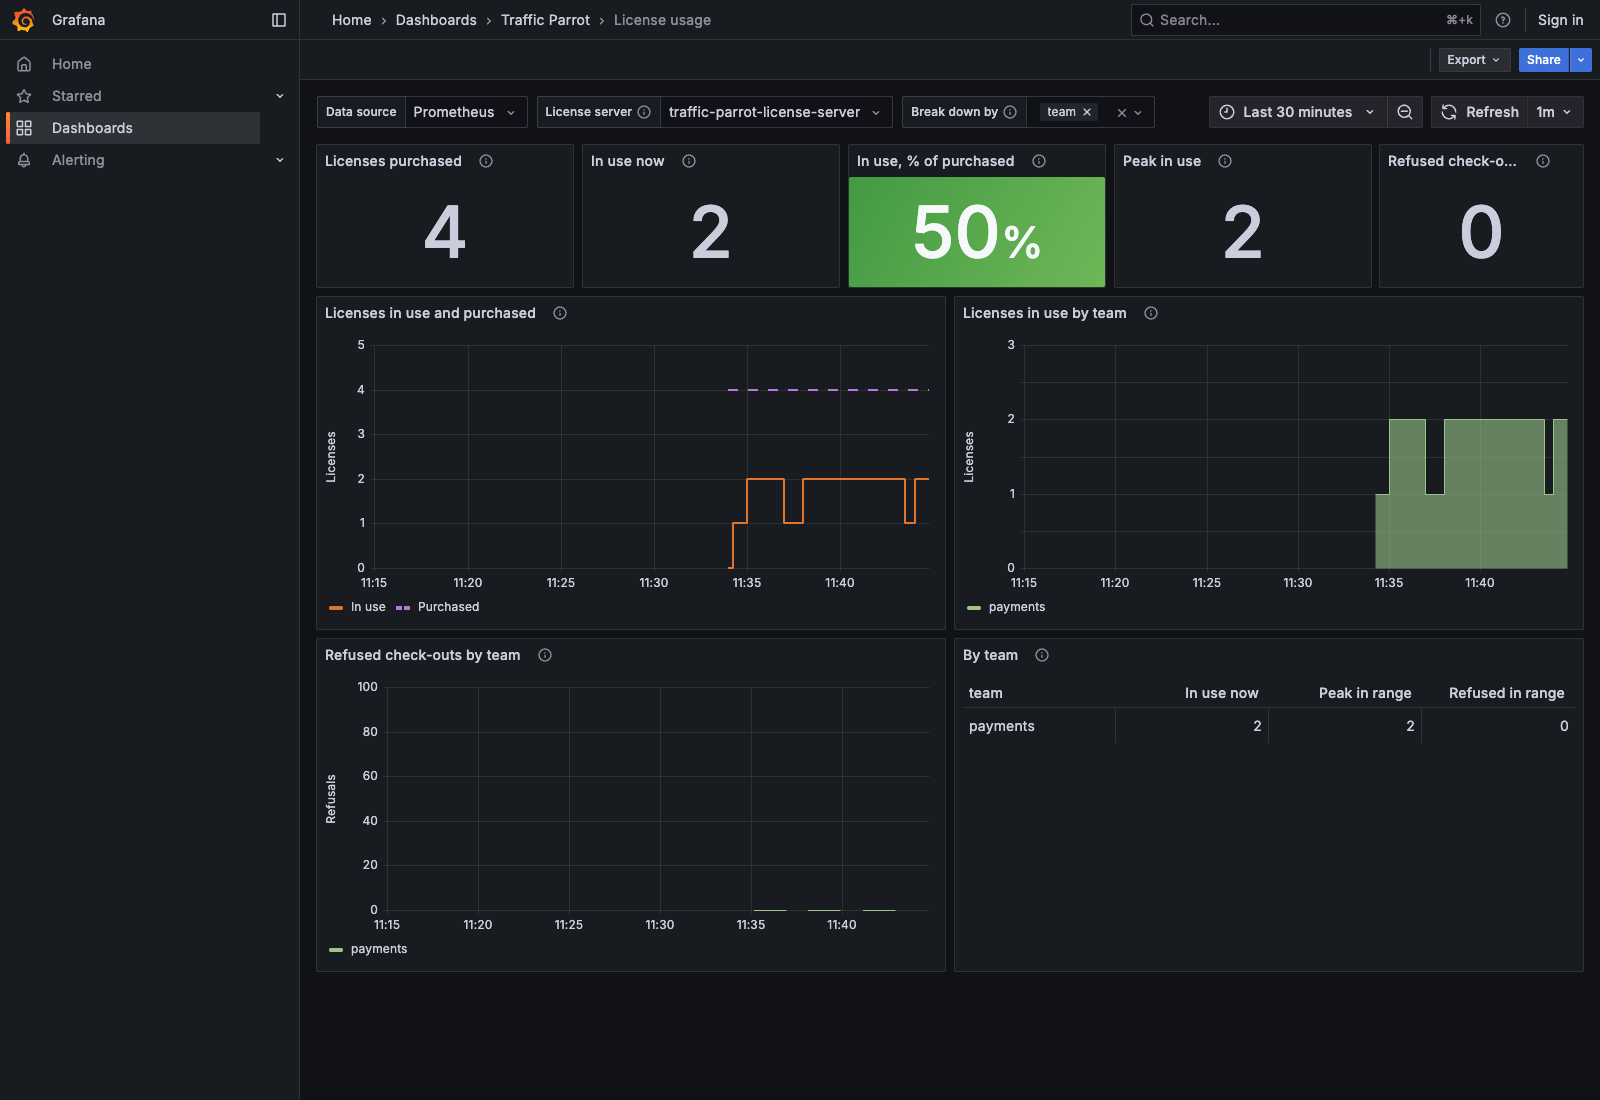
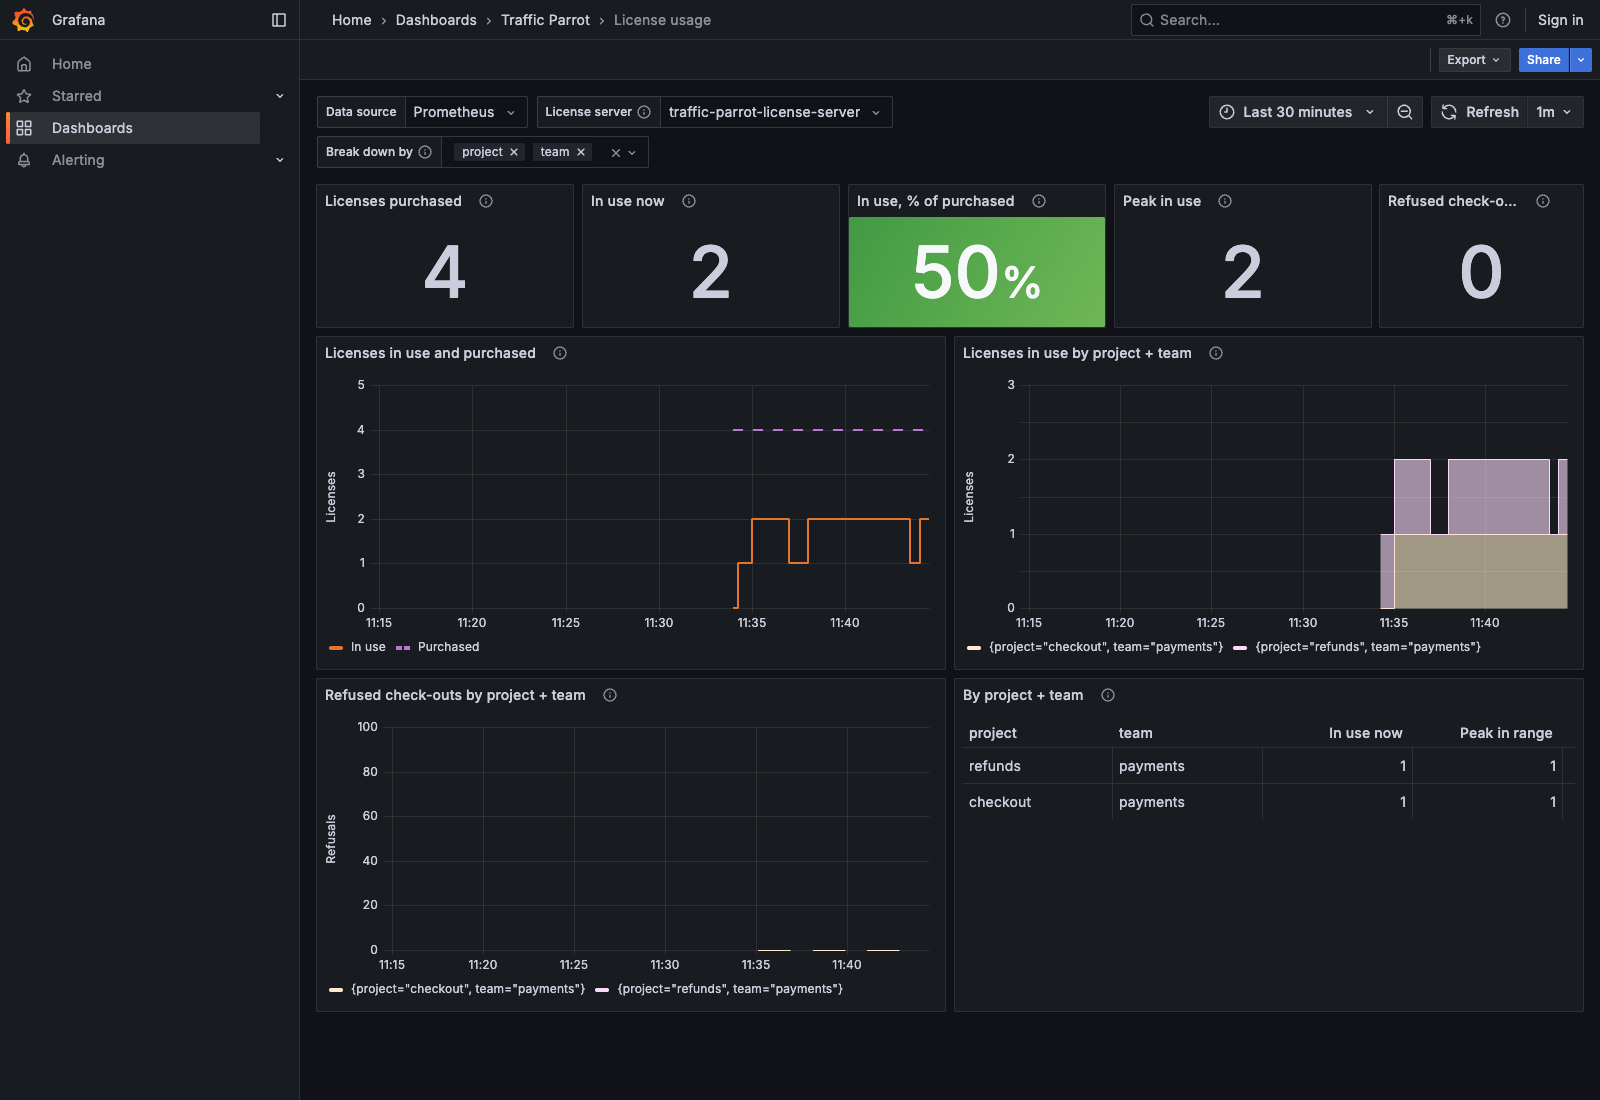
The screenshots come from a docker compose set-up that runs the whole chain: a license server with metrics on, two Traffic Parrot instances checking licenses out from it under the team tag payments and the projects checkout and refunds, Prometheus scraping the license server every 15 seconds, and Grafana with the dashboard provisioned as its home page. Within about two minutes of starting, it shows two licenses in use, one per project.
Download the License usage dashboard from the license server's home page, under Monitoring, or with GET /api/monitoring/dashboards/license-usage.json on one of its user interface ports, whether its metrics are on or off. Both dashboards are also here: license-usage.json and feature-usage.json.
The Feature usage dashboard shows the instance metrics of the instances one Prometheus job scrapes. A running instance serves the file, whether metrics are on or off: download it from Tools, Monitoring, or with GET /api/configuration/monitoring/dashboards/feature-usage.json on a user interface port, behind the same login as the user interface. Import it into Grafana; it takes its data source from a datasource variable. At the top you pick the data source, the Prometheus job that scrapes the instances and whether to break the figures down by project, by team or by both. Its panels show:
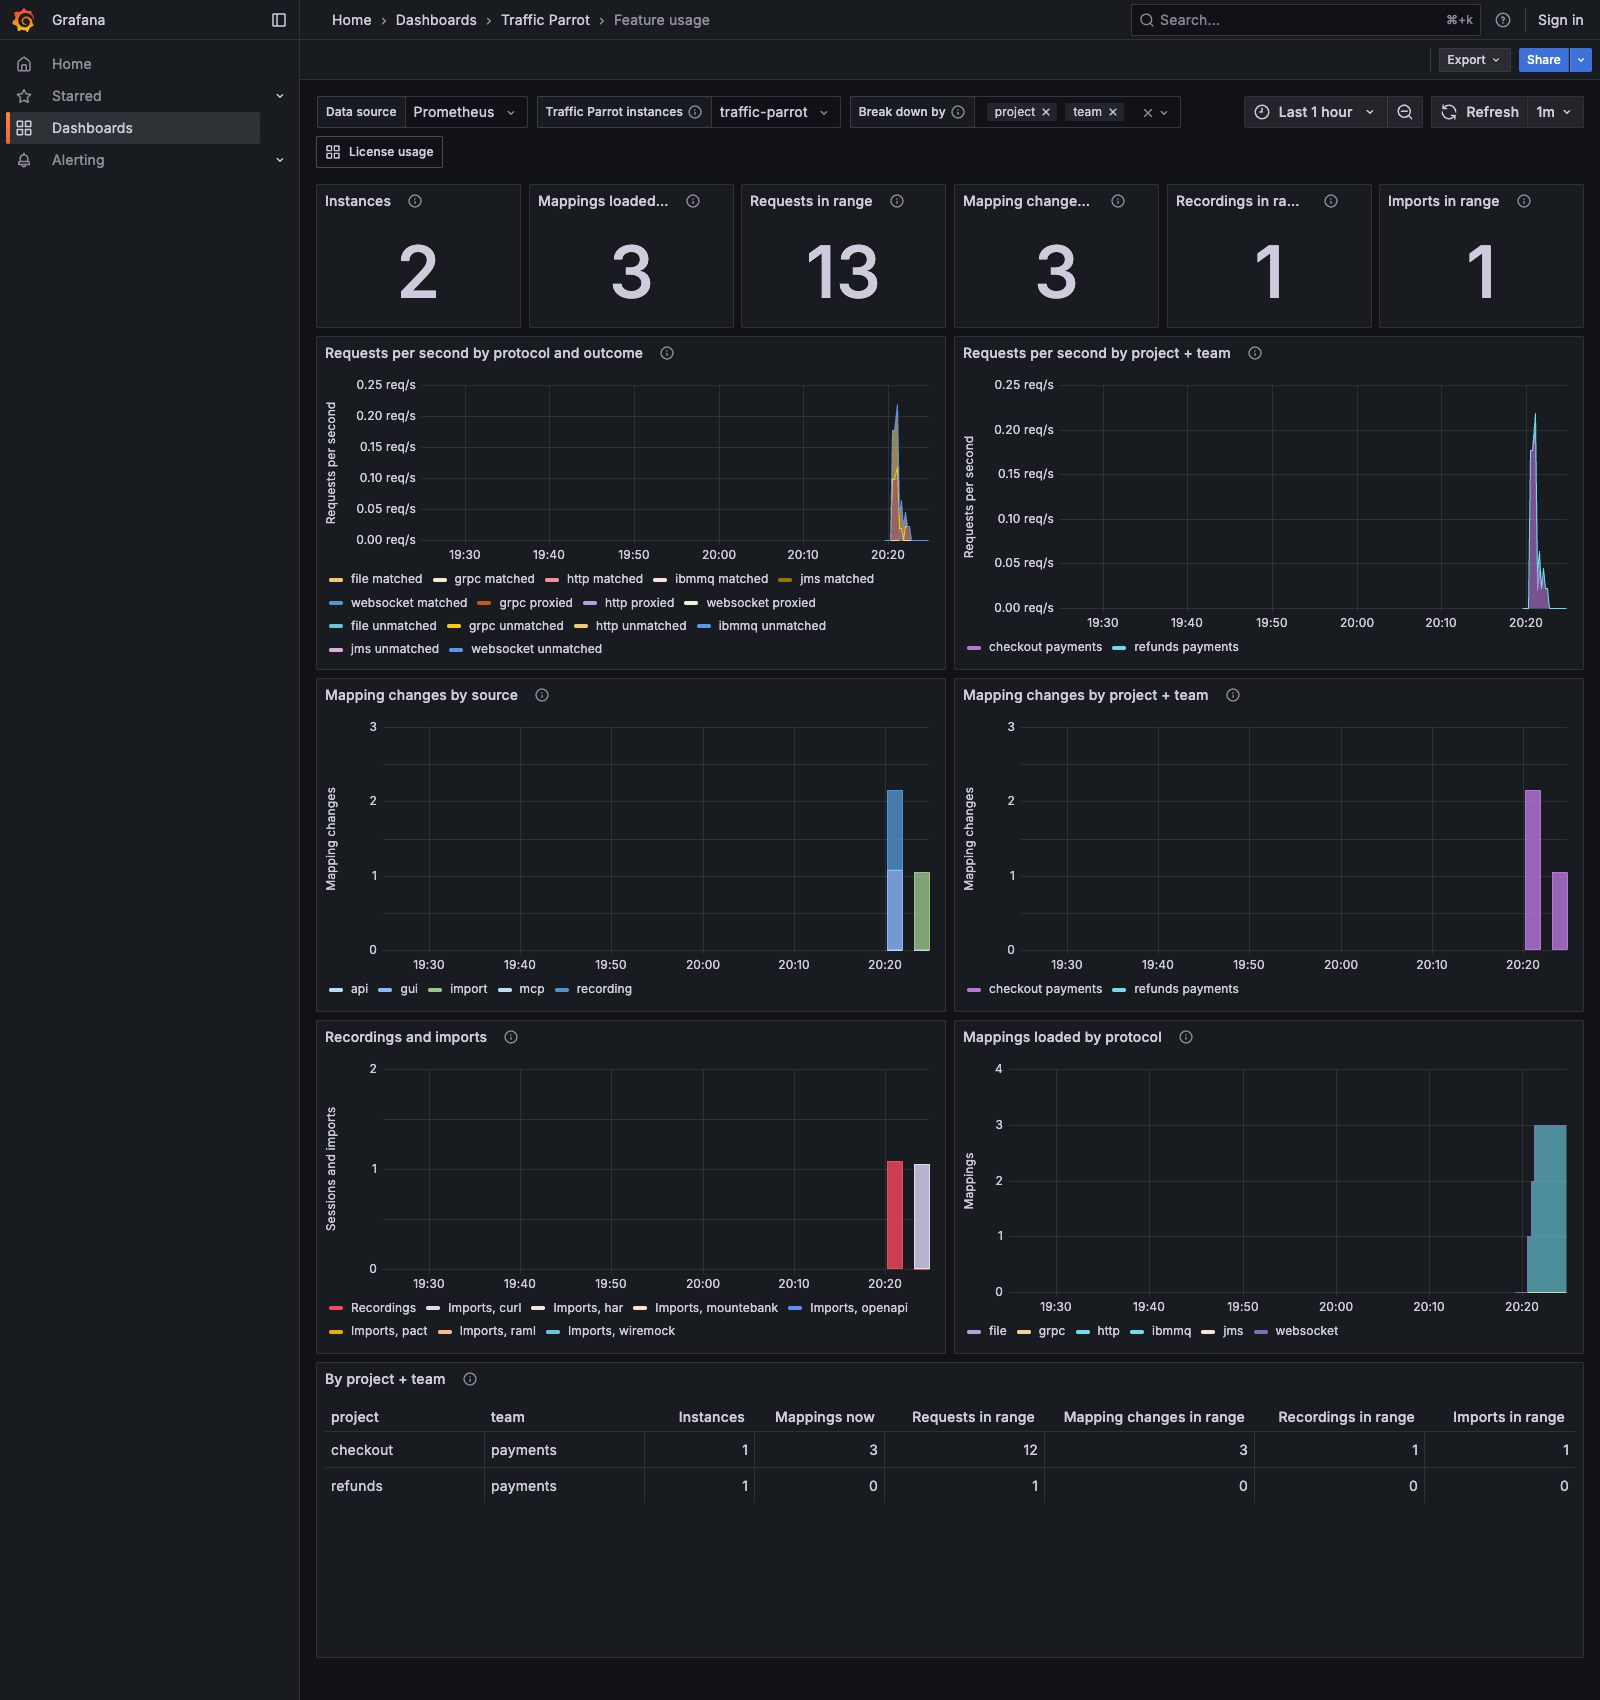
A bar in the mapping changes, recordings and imports charts can show a single change as slightly more than 1, because Prometheus's increase() extrapolates from the samples in each bar's interval; the totals at the top and in the table are rounded to whole numbers.
Each row below is a question a manager asks, the panel that answers it and the query behind that panel. The queries are the dashboards' own with the Grafana variables filled in, so each runs as it stands in Prometheus: the jobs are the ones in the scrape configurations above, the time range is the last seven days and the break-down is by project. Put team in its place to break down by team. On the dashboards, some panels that show one figure add or (0 * ...) to their query, which makes them show 0 instead of No data when nothing has been counted; the queries below leave that out.
The License usage dashboard:
| Question | Panel | Query |
|---|---|---|
| How many licenses have we bought? | Licenses purchased | max(tp_licences_purchased{job="traffic-parrot-license-server"}) |
| How many are in use now? | In use now | sum(tp_licences_in_use{job="traffic-parrot-license-server"}) |
| What share of them is in use? | In use, % of purchased | 100 * sum(tp_licences_in_use{job="traffic-parrot-license-server"}) / max(tp_licences_purchased{job="traffic-parrot-license-server"}) |
| What is the most we used at once this week? | Peak in use | max_over_time((sum(tp_licences_in_use{job="traffic-parrot-license-server"}))[7d:1m]) |
| Was anyone refused a license this week? | Refused check-outs | round(sum(increase(tp_licence_rejections_total{job="traffic-parrot-license-server"}[7d]))) |
| Which projects hold the licenses now? | Licenses in use by project, and the By project table | sum by (project) (tp_licences_in_use{job="traffic-parrot-license-server"}) |
| What was each project's peak this week? | By project table | max_over_time((sum by (project) (tp_licences_in_use{job="traffic-parrot-license-server"}))[7d:1m]) |
| Which projects were refused a license this week? | By project table | round(sum by (project) (increase(tp_licence_rejections_total{job="traffic-parrot-license-server"}[7d]))) |
The two refused rows count check-outs refused because no license was free, so they stay at 0 under a license that does not enforce its limit. They also leave out a refusal by a license server that is not activated, and the first refusal of a project or team that holds no license at that moment.
The Feature usage dashboard:
| Question | Panel | Query |
|---|---|---|
| How many Traffic Parrot instances are running? | Instances | count(tp_instance{job="traffic-parrot"}) |
| Which projects run them? | By project table | count by (project) (tp_instance{job="traffic-parrot"}) |
| How many mappings do they have loaded? | Mappings loaded now | sum(tp_mappings{job="traffic-parrot"} >= 0) |
| For which protocols? | Mappings loaded by protocol | sum by (protocol) (tp_mappings{job="traffic-parrot"} >= 0) |
| How many requests did they serve this week? | Requests in range | round(sum(increase(tp_requests_total{job="traffic-parrot"}[7d]))) |
| Which projects' instances served them? | By project table | round(sum by (project) (increase(tp_requests_total{job="traffic-parrot"}[7d]))) |
| How busy are they now, and do requests find a mapping? | Requests per second by protocol and outcome | sum by (protocol, outcome) (rate(tp_requests_total{job="traffic-parrot"}[5m])) |
| Are people still changing mappings? | Mapping changes in range | round(sum(increase(tp_mapping_changes_total{job="traffic-parrot"}[7d]))) |
| How do they change them: a page, the API, MCP, an import or a recording? | Mapping changes by source | sum by (source) (increase(tp_mapping_changes_total{job="traffic-parrot"}[7d])) |
| How often did someone record this week? | Recordings in range | round(sum(increase(tp_recording_sessions_total{job="traffic-parrot"}[7d]))) |
| How often did someone import this week? | Imports in range | round(sum(increase(tp_imports_total{job="traffic-parrot"}[7d]))) |
In a chart Grafana sets the interval itself, so Requests per second by protocol and outcome and Mapping changes by source draw their figure over time; the five minutes and seven days above give one figure each.